
Risk-based inspection: how operators prioritise pipeline segments
Risk-based inspection ranks pipeline segments by combining the probability of a failure with the consequence if one occurred, so that inspection budget and effort are pointed at the segments carrying the most real risk rather than spread uniformly across an entire network. It replaces fixed-interval, walk-the-whole-line inspection with a structured, data-driven prioritisation that most regulators now expect for transmission pipelines and that operators increasingly need for growing distribution networks as well.
What is risk-based inspection?
Risk-based inspection is a methodology that ranks pipeline segments for inspection priority by multiplying an estimated probability of failure by the consequence if that failure occurred. It replaces uniform, calendar-driven inspection of an entire network with a targeted approach that spends the most inspection effort where risk is actually concentrated.
Risk-based inspection ranks pipeline segments by combining the probability of a failure with the consequence if one occurred, so that inspection budget and effort are pointed at the segments carrying the most real risk rather than spread uniformly across an entire network. For a pipeline network that can run into hundreds or thousands of kilometres, treating every segment identically is neither affordable nor sensible - risk-based inspection is the structured alternative that most transmission-pipeline regulators now expect, and that operators of growing distribution networks increasingly need as their own inspection capacity comes under pressure.
What problem does risk-based inspection actually solve?
Before risk-based methodologies became standard, the typical inspection model was time-based: every segment of pipeline got inspected on the same fixed interval, usually driven by the maximum interval a regulator would allow. That approach treats a quiet rural segment with excellent coating and strong cathodic protection the same as a decades-old segment crossing a river near a populated area with a documented history of coating damage - even though the two carry wildly different real-world risk. Risk-based inspection exists to correct that mismatch: it directs more frequent, more rigorous inspection to the segments that actually warrant it, and allows lower-risk segments to be inspected less intensively, within whatever regulatory floor applies.
How is a risk score actually calculated?
A risk score is generally the product of two components, evaluated separately for each pipeline segment.
Probability of failure draws on the threats a segment faces: pipe age and material, coating type and its known degradation pattern, cathodic protection history and any documented gaps, soil corrosivity, wall thickness relative to design pressure, and findings from prior inspections such as in-line inspection runs or direct examinations. A segment with ageing coating, a history of inadequate CP readings, and aggressive soil chemistry scores higher on probability than a newer segment with strong, well-documented protection.
Consequence of failure captures what happens if that segment does fail: class location (population density along the route), proximity to environmentally sensitive areas or drinking-water sources, and the pipeline's operating pressure and diameter, which determine how large a release could be. A segment running through a densely populated area scores far higher on consequence than an equivalent segment in open rural land, even if their probability of failure is identical.
Multiplying these two components together - rather than looking at either alone - is what makes the method work: a high-probability, low-consequence segment and a low-probability, high-consequence segment can land at a similar priority level, which matches how a careful engineer would actually reason about the trade-off.
| Risk component | Typical inputs | What it estimates |
|---|---|---|
| Probability of failure | Pipe age and material, coating type/condition, cathodic protection history, soil corrosivity, wall thickness, prior inspection findings | How likely a failure is at this segment |
| Consequence of failure | Class location (population density), proximity to water bodies or sensitive environments, operating pressure and diameter | How severe a failure would be if it happened |
| Combined risk score | Probability × consequence, per segment | Where inspection budget and effort should go first |
What does risk-based inspection change in practice?
Once segments are ranked, the practical effects follow directly. High-risk segments get shorter inspection intervals, more rigorous methods (such as in-line inspection rather than indirect surveys), and faster response timelines when an anomaly is found. Lower-risk segments can be inspected less frequently or with lighter-touch methods, freeing up budget and field crews to concentrate where it matters. Over successive cycles, the ranking is also expected to update as new data comes in - a segment that scored as low-risk five years ago but has since accumulated coating defects or a documented CP gap should move up the list, not stay frozen at its original assessment.
Why does risk-based inspection depend on good underlying data?
The entire method is only as good as the data feeding it. A risk score built on stale, incomplete, or poorly geolocated inspection history will misrank segments regardless of how sound the scoring formula is - which is a real, common failure mode in practice, since much of the underlying data (coating records, CP survey history, prior anomaly findings) is often scattered across paper records, disconnected systems, or institutional memory rather than a single structured, current source. Improving the underlying data quality and currency that feeds a risk model is frequently a bigger lever on inspection outcomes than refining the risk formula itself, and it is exactly the kind of unglamorous, foundational problem that determines whether a risk-based program is genuinely prioritising the right segments or just producing a well-organised list built on outdated inputs.
Related reading
Regulators increasingly expect risk-based prioritisation to sit inside a documented Integrity Management System. For how CUI specifically gets folded into a risk score, see corrosion under insulation. To see risk-based prioritisation applied directly, try the free inspection priority score estimator.
Questions this raises
Last updated: 26 July 2026
LeakSonic Research. "Risk-based inspection: how operators prioritise pipeline segments." LeakSonic Private Limited, 2026. https://leaksonic.com/blog/risk-based-inspection-pipelines
<a href="https://leaksonic.com/blog/risk-based-inspection-pipelines" target="_blank" rel="noopener">Risk-based inspection: how operators prioritise pipeline segments</a> - via LeakSonic
Related reading
View all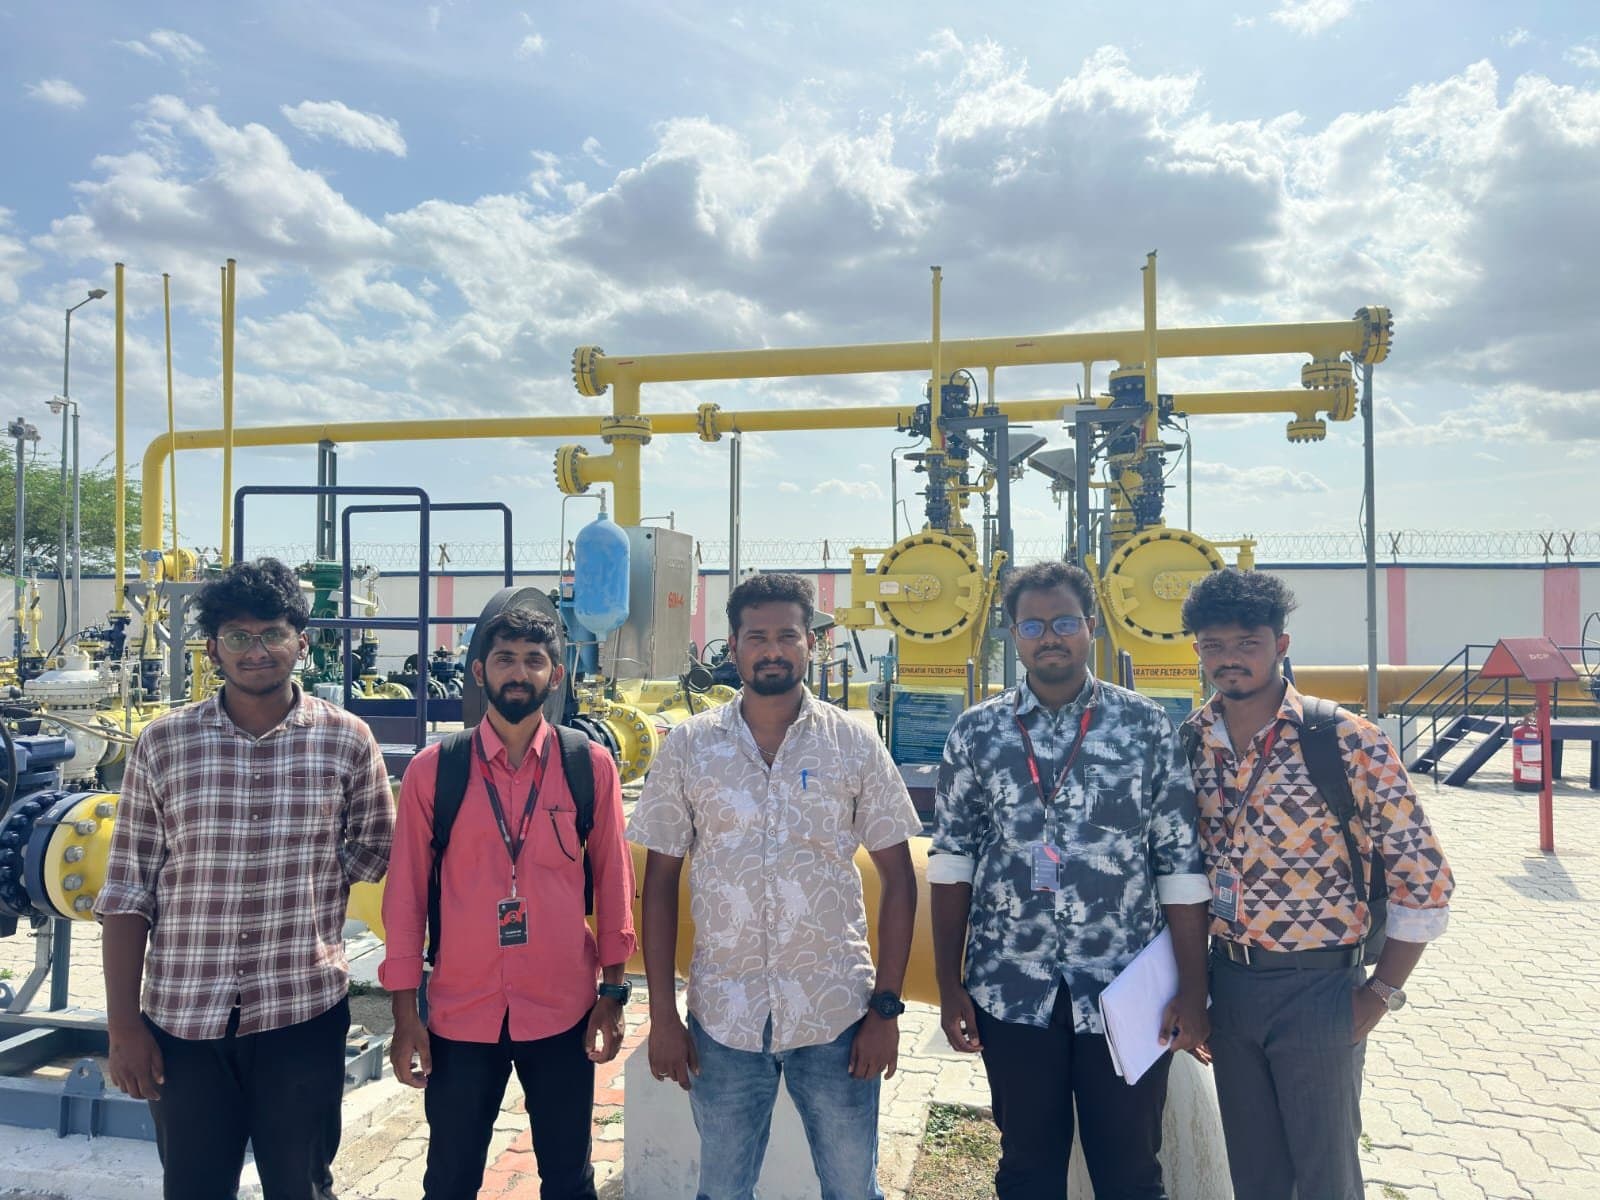
SV and IP stations: the pipeline infrastructure that keeps gas safe
Sectionalizing Valve (SV) stations and Intermediate Pressure Regulation (IP) stations are the unsung infrastructure that keeps gas pipeline networks safe, balanced, and running - seen firsthand during LeakSonic's field visit with Indian Oil Corporation.
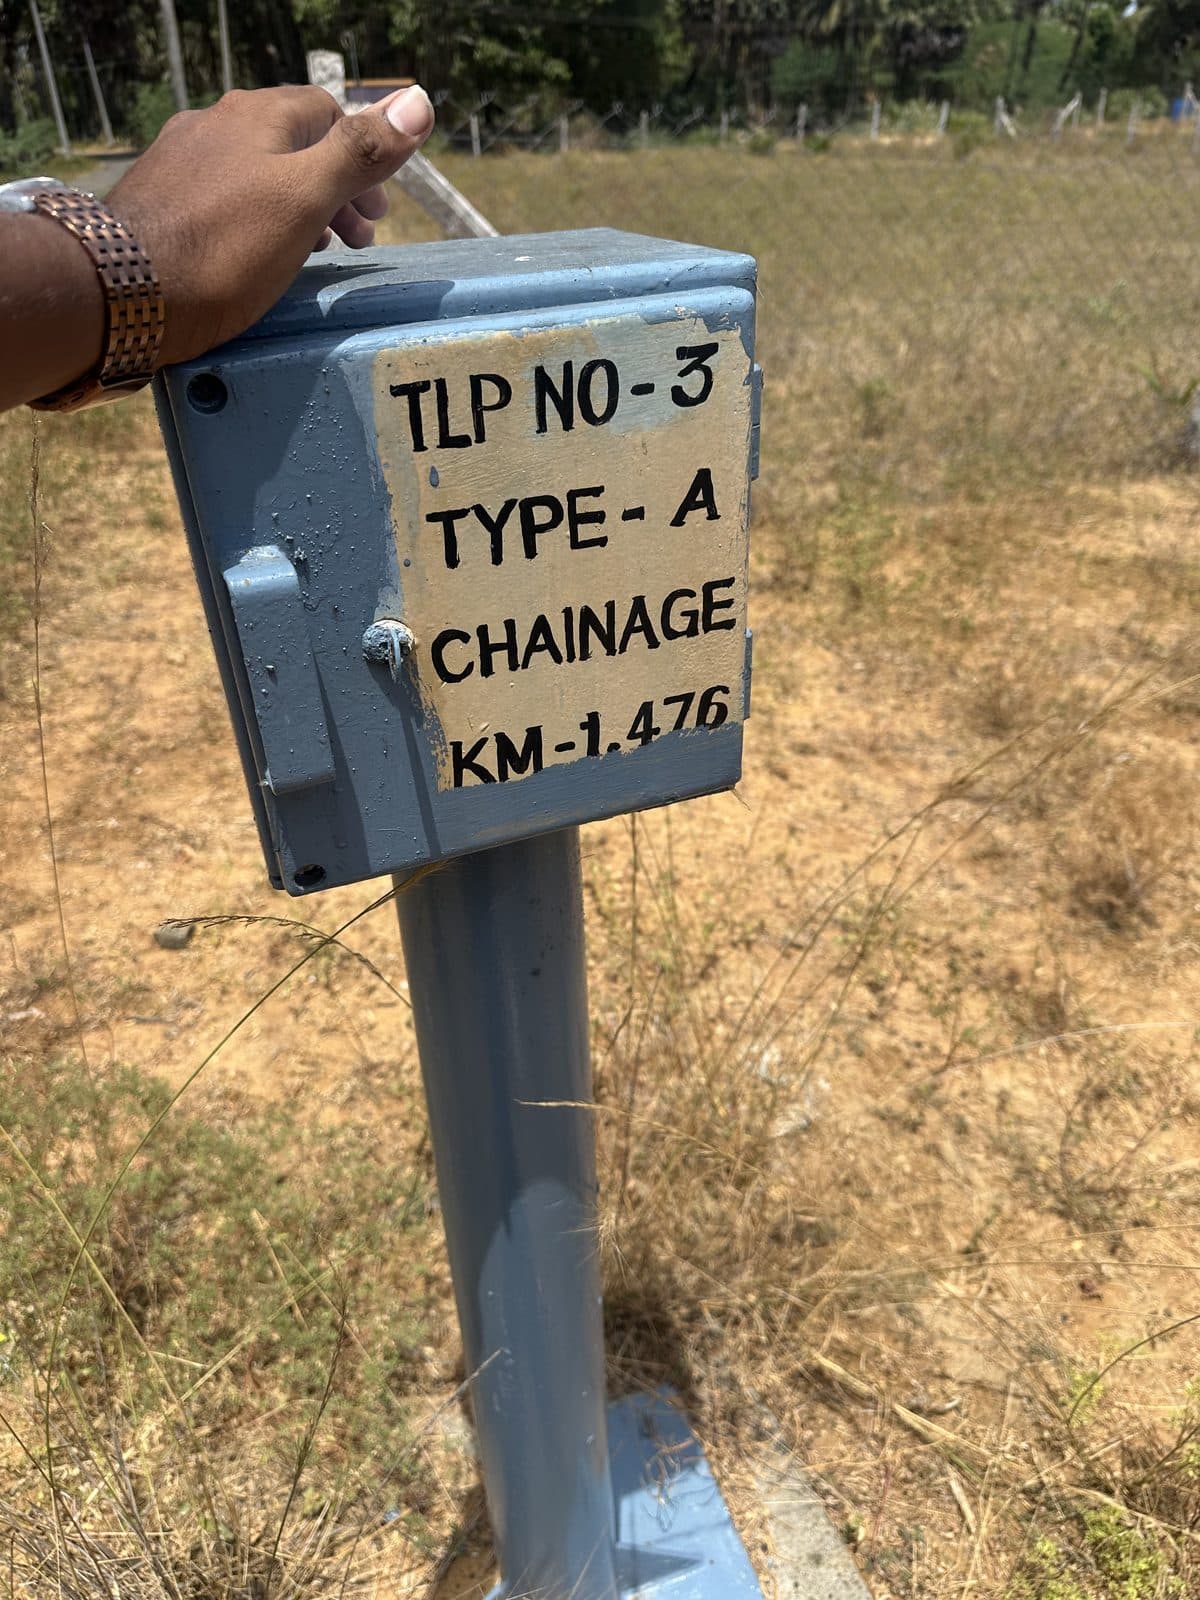
What are cathodic protection test lead points, and why they matter
What are cathodic protection test lead points, and why do they matter? A look at how underground pipelines are protected from corrosion - and monitored - decades after they are buried, seen firsthand during LeakSonic's field visit with Indian Oil Corporation.
Where does your inspection programme sit on the path to measurement-based reporting?
The shift from estimated to measured methane reporting under frameworks like OGMP 2.0 is well underway, but most operators have no quick way to see where their own workflow currently sits on that path. We built a free five-question Integrity & Methane Reporting Readiness Assessment to give a directional answer in under two minutes.